
OECD's Subsidy-Centric Narrative of China’s Emerging Industries Is Increasingly Flawed and Outdated: CF40 research
Zhu He & Guo Kai examine more than 5,300 A-share companies and argue that China’s new economy is increasingly driven by internal cash flow, equity financing, and profitability rather than cheap credit


On June 1, 2026, the OECD released a report titled OECD MAGIC Database of Industrial Subsidies. Its central argument is that Chinese firms receive far larger industrial subsidies than those in other economies, concentrated in emerging strategic industries such as solar, semiconductors and wind power.
The report enters an already charged debate. In Europe, the U.S., and other advanced economies, China’s industrial rise is often explained less by efficiency than by state support: subsidies and cheap credit, the argument goes, have allowed less productive Chinese firms to undercut more innovative competitors on price.
But a new study by Zhu He and Guo Kai of the China Finance 40 Forum (CF40) challenges that premise. Based on annual reports from more than 5,300 non-financial A-share listed companies between 2018 and 2025, it finds that China’s emerging industries are not especially debt-dependent, do not rely mainly on long-term bank credit, and receive only a minority share of government subsidies. Much of the new borrowing, instead, has flowed to old-economy sectors such as construction, utilities, and transport.
With the authors’ authorisation, we are pleased to present the report in full below.
ZHU He, Research Fellow at the CF40. With over ten years of experience in macroeconomic research, Zhu He specializes in tracking domestic and international macroeconomic trends and capital market dynamics. He provides unique insights into economic policy and asset allocation strategies and is a key contributor to CF40’s Macroeconomic Policy Quarterly Report, which has gained significant attention from the market and policymakers. He holds a PhD in Economics from the Chinese Academy of Social Sciences and a postdoctoral degree from Peking University.

GUO Kai, Executive President and Senior Fellow of the CF40. Before joining the CF40, he was an economist at the International Monetary Fund in Washington DC and then worked at the People’s Bank of China in various capacities, including leading positions in the Monetary Policy Department and the International Department. His main research areas include the Chinese economy and its macroeconomic policies as well as international finance. He is the author of three popular Chinese economics books and multiple academic papers in various English and Chinese journals. He holds a PhD degree in economics from Harvard University.
Founded in 2008, China Finance 40 Forum (CF40) is a leading independent think tank focused on policy research in macroeconomics and finance. Its core membership consists of 40 leading experts from government, financial institutions and academia around the age of 40. In 2021, the CF40 Institute was established to strengthen CF40’s research capacity. In 2024, the CF40 Institute introduced an original research product, CF40 Research, aimed at providing independent insights into China’s macroeconomy, policy trends, financial market dynamics, and global affairs. CF40 Research currently features English product series, including Policy Brief, Commentary, and Podcast.
Why the OECD’s Subsidy-Centric Narrative of China’s Emerging Industries Is Increasingly Flawed and Outdated
ZHU He, GUO Kai
CF40 Institute
Abstract: In a recent report, the OECD contends that the rise of China’s emerging industries has rested largely on government subsidies—with lending from the state-owned banking system as a principal channel—and that these subsidies, more than any other factor, account for the international competitiveness of Chinese firms. We examine this contention using the 2018–2025 annual reports of more than 5,300 non-financial companies listed on China’s A-share market. Classifying firms by R&D intensity and profitability, we divide the sample into a “new economy” and an “old economy”; the former corresponds closely to what the OECD designates as China’s emerging industries, namely electric vehicles, batteries and solar, together with computing, semiconductors and related sectors.
We then assess each channel through which a subsidy-driven account would be expected to manifest: the industries to which new interest-bearing debt flows, the maturity structure of that debt, the extent to which internal funds cover firms’ capital expenditure, the balance between equity and debt in external financing, and the distribution of government subsidies. On each dimension, the evidence indicates that the proposition that China’s emerging industries depend on subsidies is both outdated and misguided. Relative to the old economy, the new economy carries less interest-bearing debt and of shorter maturity, generates more internal funds, and finances itself primarily through equity rather than borrowing—a profile inconsistent with reliance on subsidized credit. Government subsidies, for their part, peaked in 2022 and have declined since, and roughly two-thirds accrue to the old economy. While certain emerging-industry firms did rely substantially on subsidies in their early years, most exhibit only limited dependence on either subsidies or credit; notably, it was precisely during the period of most rapid expansion that subsidies contracted and their bearing on the new economy diminished. A separate analysis of 57 representative listed firms in the sector yields consistent results.
These findings imply that neither credit subsidies nor cash subsidies can account for the rapid expansion of China’s new economy in recent years. Three broader implications follow. First, that a conclusion so consequential should be drawn from so limited a sample is a practice that could materially undermine the credibility of a multilateral institution. Second, even the complete withdrawal of subsidies would leave the prospects and global competitiveness of China’s new economy little affected, since subsidies, to the most part, did not bring these industries into being. Third, global imbalances are a genuine and serious concern; on this question China retains considerable scope to expand domestic demand and to improve the efficiency of its domestic resource allocation.
On June 1, 2026, the OECD released a report titled OECD MAGIC Database of Industrial Subsidies. Its central argument is that Chinese firms receive far larger industrial subsidies than those in other economies, concentrated in emerging strategic industries such as solar, semiconductors and wind power.
According to this view, it is subsidies—not efficiency—that have driven the global expansion of Chinese firms. Yet these subsidies have not boosted productivity or profitability; rather, akin to industrial doping, they allow less efficient firms to undercut more innovative competitors on price.
In short, the report contends that China’s emerging industries have grown primarily on the back of strong government subsidies, with credit support from the banking system serving as an important channel. At the same time, several economies have shown signs of using such findings to justify tariffs on, and restrictions of, Chinese products.
The OECD database covers some 525 manufacturing firms worldwide, of which 147 are Chinese—a small sample. Within the OECD’s framework, these subsidies are delivered mainly in three forms: government grants, tax preferences, and loans extended by state-owned or policy banks at below-market rates.
The OECD estimates that over 2005–2024, subsidies amounted to 2.4 percentage points of the revenue of its Chinese sample firms, of which 1.6 percentage points—two-thirds—came from so-called preferential loans. Absent these preferential loans, Chinese firms would have received no more subsidy than manufacturers in other countries.
The OECD’s estimate of these preferential loans rests on a clear conceptual error. Its approach treats the LPR as the most preferential rate, adds a risk premium and other adjustments to derive a theoretical lending rate, and then measures the credit subsidy as the gap between the actual and the theoretical rate.
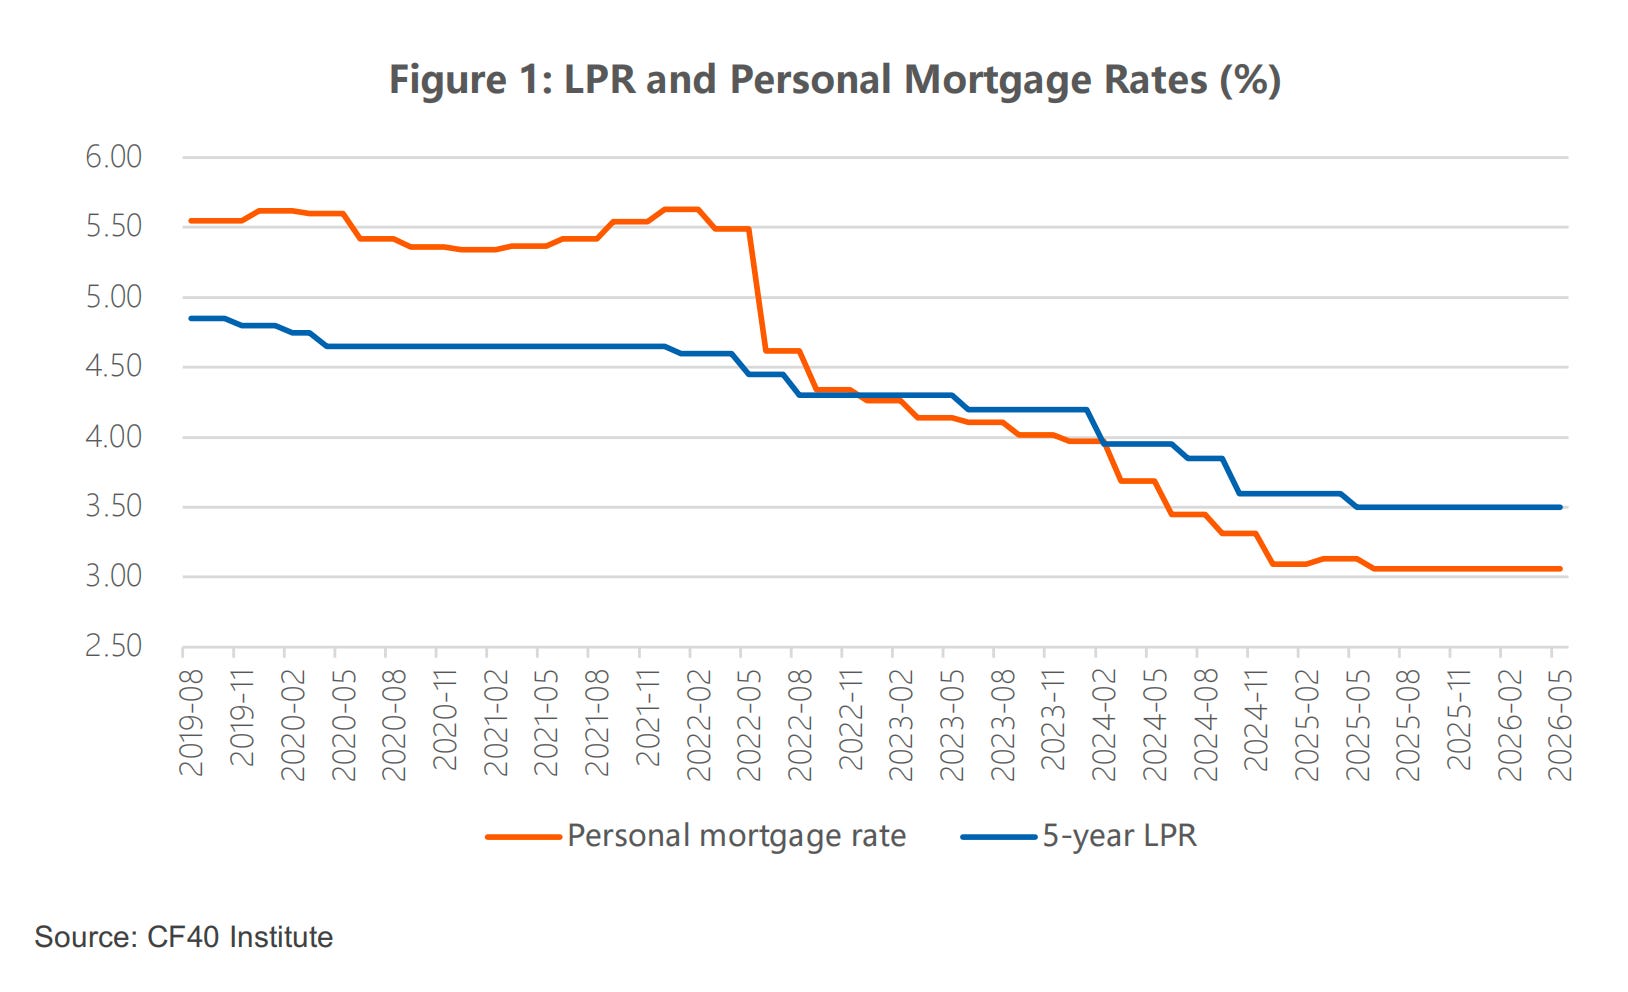
The flaw is that the LPR cannot serve as the most preferential lending rate, because in practice it functions closer to an average or median rate. According to the China Monetary Policy Report for the first quarter of 2026, in March 2026 some 48.8% of loans were priced below the LPR, 9.3% at the LPR, and 41.9% above it. Indeed, if one insisted on treating the LPR as a benchmark and inferring large subsidies, one would reach an absurd conclusion: that since 2023 China has likewise been heavily subsidizing households, because personal mortgage rates have stayed below the 5-year LPR and the gap has kept widening. Clearly this has nothing to do with any subsidy—the main reason mortgage rates fell is weaker housing demand, and the rate is a genuine response to changing fundamentals.
For the OECD’s narrative to hold, two necessary conditions must be met simultaneously. First, structurally, subsidies—whether in credit or cash form— must flow disproportionately to the emerging industries. If the main recipients lie elsewhere, the claim that subsidies nurtured the emerging industries collapses. Second, in terms of scale, subsidies would need to be large enough to meaningfully support the expansion of emerging industries. If these industries rely little on subsidies, then even the subsidies they receive cannot justify the argument that their growth is subsidy-driven. Both conditions are indispensable; if either fails, the entire narrative becomes difficult to sustain.
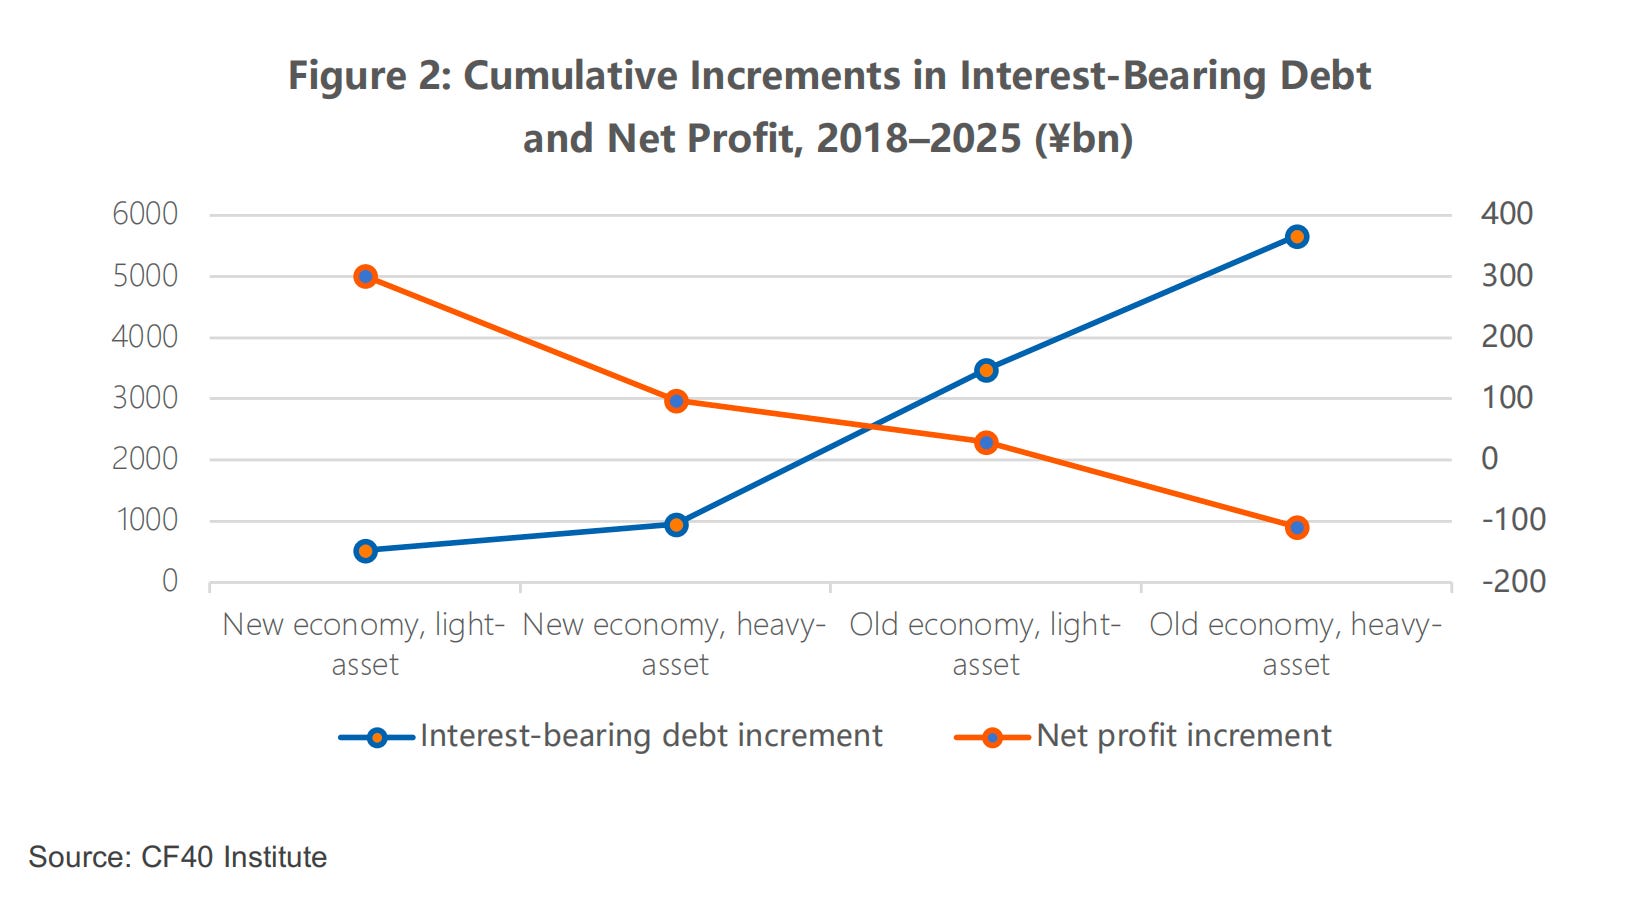
In a recent CF40 Policy Brief, we sorted more than 5,000 Chinese listed companies into “new economy” and “old economy” using R&D intensity, profitability and related dimensions, and documented how the new economy has grown rapidly across many fields in recent years and gradually overtaken the old economy. As Figure 2 makes clear, one defining feature of the new- economy industries is markedly lower reliance on debt: they generate more profit with less debt. (See CF40 Policy Brief The New Economy Rises as the Old Economy Recedes – Evidence from China’s Listed Companies)
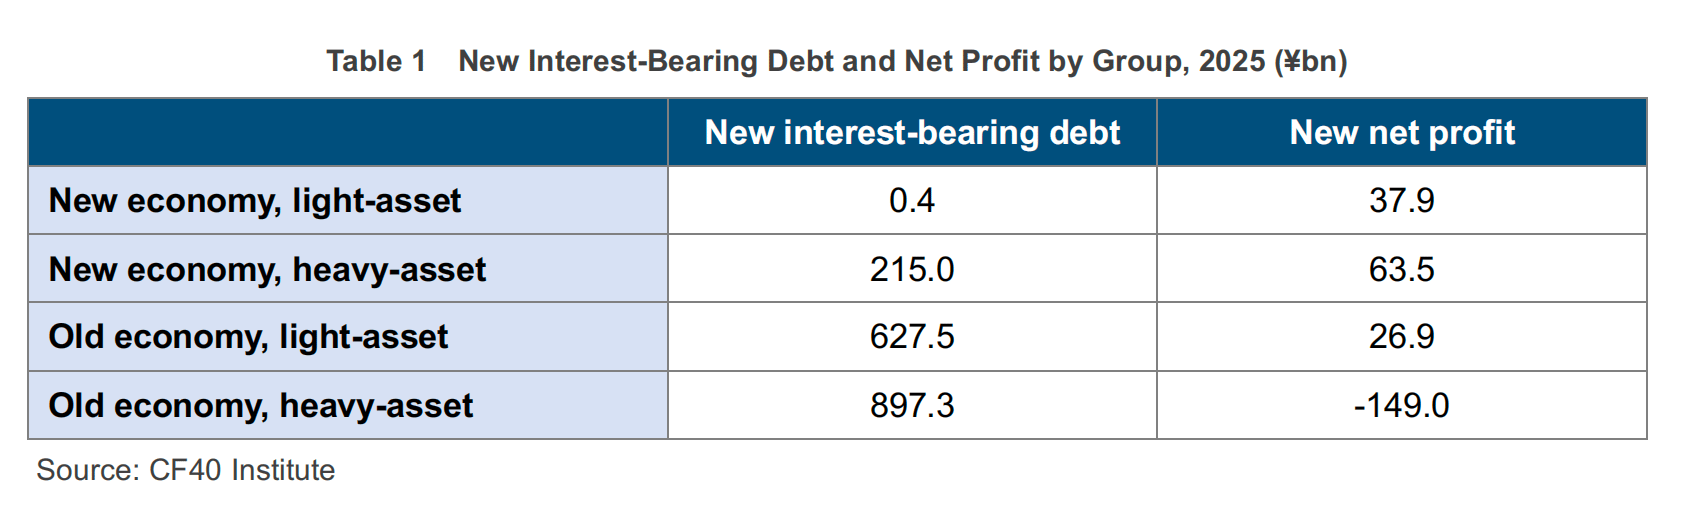
The year 2025 offers a particularly representative illustration. In 2025, firms in the new economy, light-asset group added just 0.4 billion yuan of interest- bearing debt yet generated 37.9 billion yuan in incremental net profit. By contrast, firms in the old economy, heavy-asset group added 897.3 billion yuan of interest-bearing debt while their net profit fell by 149.0 billion yuan.
In short, if the new-economy industries were truly the beneficiaries of financial subsidies, they should display the double-high pattern of more debt and more profit—not the asymmetric combination of debt increments concentrated in the old economy and profit increments coming from the new economy.
In the OECD report, the emerging industries are defined as the rapidly rising sectors led by solar and semiconductors—precisely the new economy we examine. This Brief therefore continues the earlier analytical framework. Using annual-report data for more than 5,300 non-financial A-share listed companies over 2018–2025, it characterizes the differences between the new and old economy in financing patterns and reliance on government subsidies—across the industry flow of interest-bearing debt, debt maturity, the coverage of internal funds, the equity-versus-debt mix of external financing, and government subsidies—to argue comprehensively why China’s emerging industries run on subsidies is a mistaken narrative.
I. Industries Receiving the Most Interest-Bearing Debt Are Not Concentrated in the New Economy
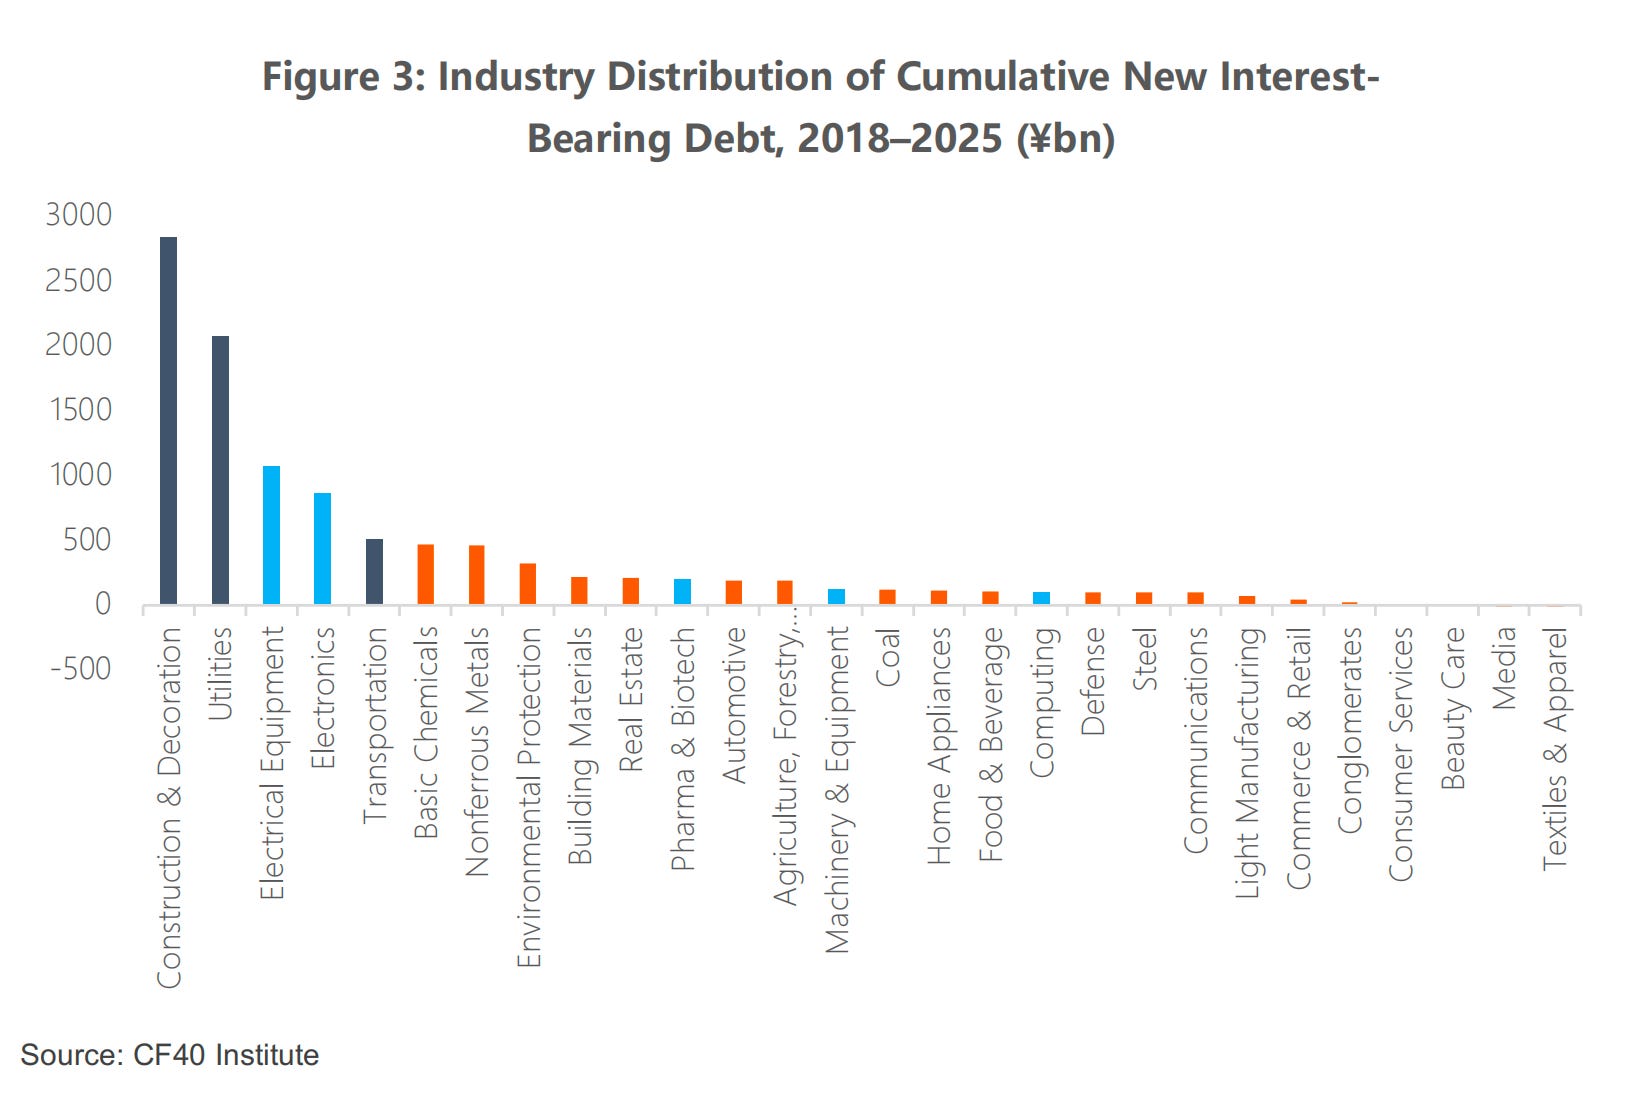
We begin with the industry flow of new interest-bearing debt over 2018–2025. As Figure 3 shows, the distribution across industries is highly uneven. Of all new interest-bearing debt at A-share firms in 2018–2025, Construction & Decoration accounted for a cumulative 2.8 trillion yuan, Utilities 2.1 trillion yuan, and Transportation 512 billion yuan—these three industries together contributed 51.1% of A-shares’ new debt, yet none belongs to the subsidized new economy of the overseas debate (the three dark-blue industries in Figure 3).
As typical representatives of the emerging industries, the five industries of Electronics, Electrical Equipment, Pharma & Biotech, Computing and Machinery & Equipment together took on about 2.37 trillion yuan of new interest-bearing debt—just 22.3% of A-shares’ new debt—even though these five industries account for roughly 44% of A-share firms (the five light-blue industries in Figure 3). In other words, at the industry level the new economy did not accumulate excessive interest-bearing debt, and therefore cannot be said to have received large credit subsidies.
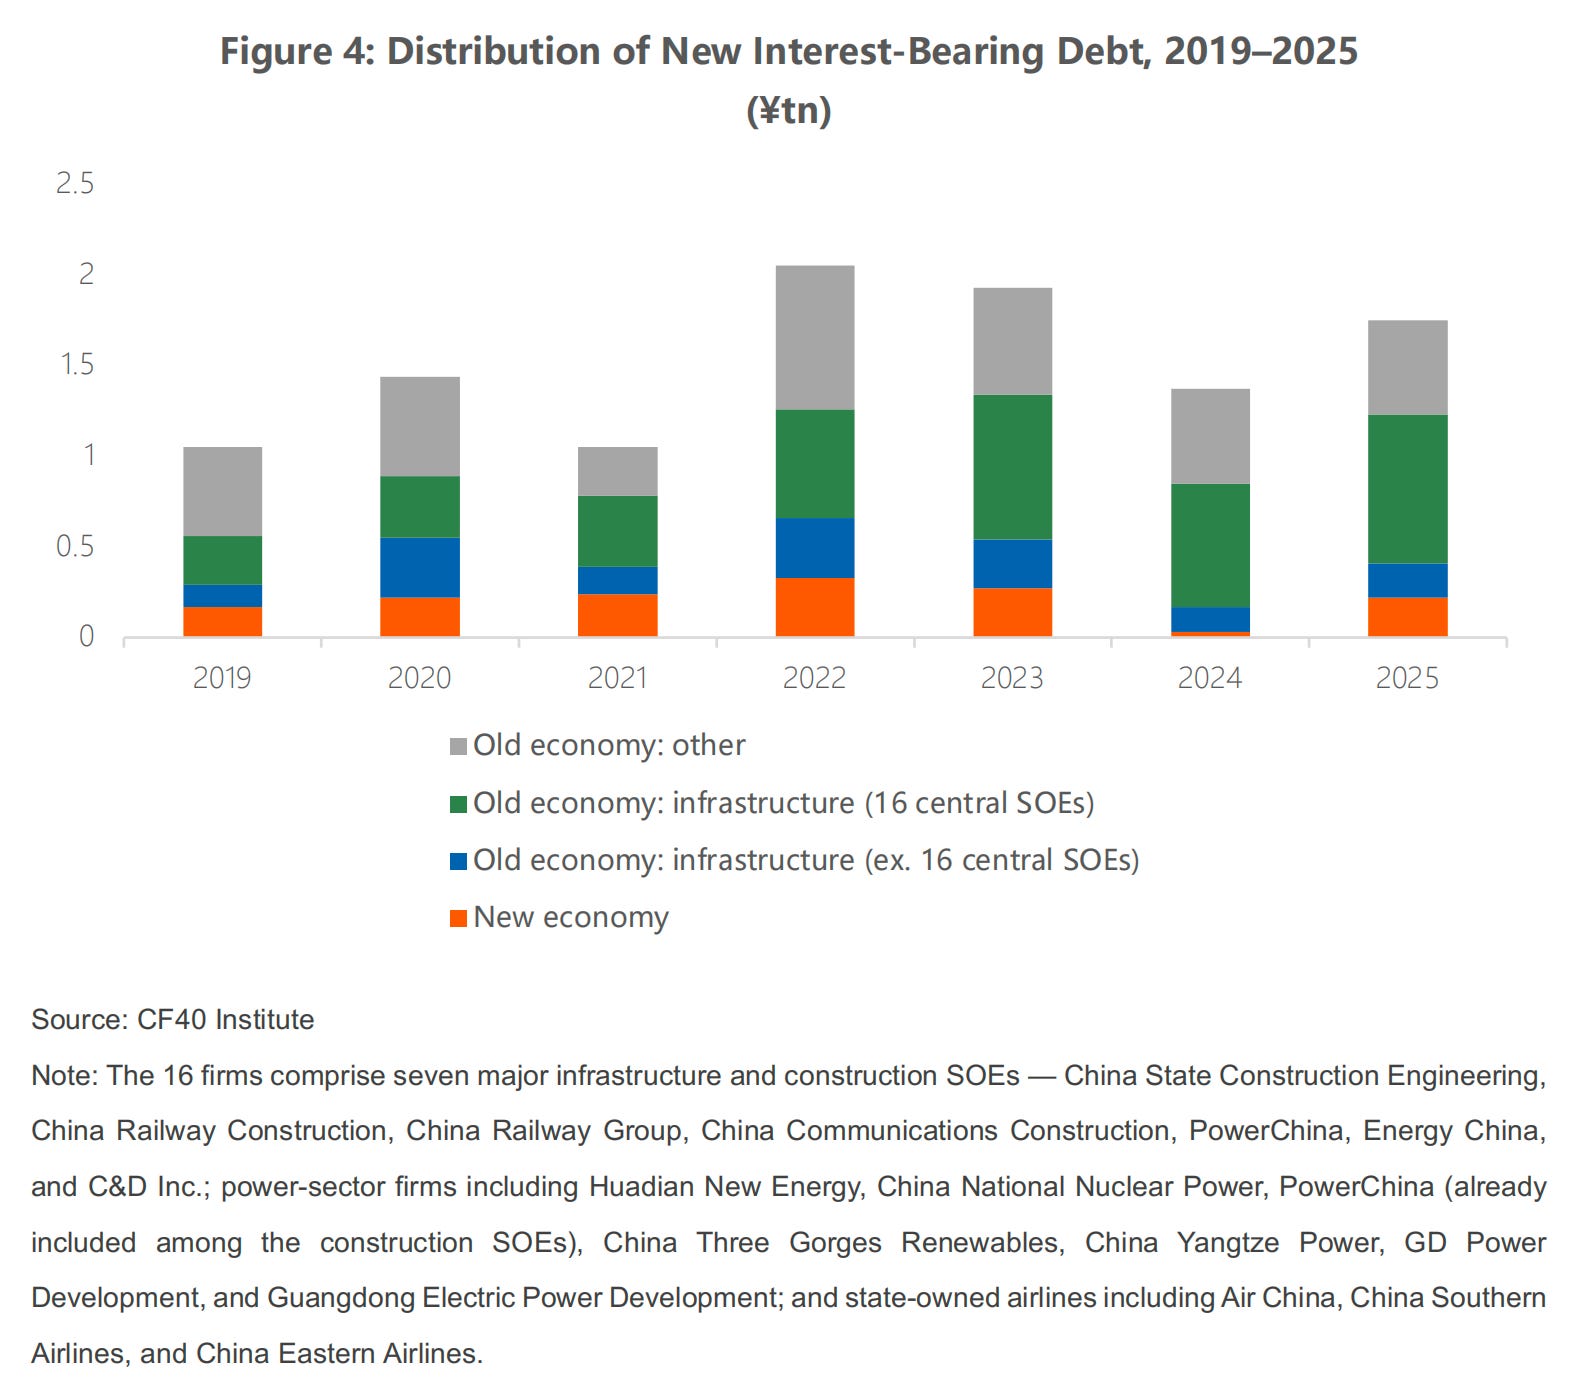
So where did the added debt actually go? The answer is clear: a substantial share of new interest-bearing debt is tied to infrastructure and power investment. We further split the old economy into infrastructure-type industries and the rest. The infrastructure-type group comprises three industries—Construction & Decoration, Utilities and Transportation—and within it we single out 16 representative central state- owned enterprises (SOEs).
As Figure 4 shows, over 2018–2025 the infrastructure-type industries were consistently the main source of new interest-bearing debt, and the 16 central SOEs were the core of that core. In 2025 these 16 firms accounted for 47% of all new interest-bearing debt that year. Over the eight years they contributed a cumulative 3.9 trillion yuan in new debt—36.7% of the total for all 5,300-plus sample firms (10.63 trillion yuan) and 2.6 times the combined new interest- bearing debt of the more than 3,189 new economy firms over the same period.
Among the construction SOEs, for example, China Railway Construction, China Railway and China Communications Construction each added roughly 500 billion yuan of interest-bearing debt over 2018–2025. These heavy borrowers are classic traditional infrastructure SOEs, and their expansion has little direct impact on the global competitiveness of emerging industries under discussion internationally.
II. The New Economy Has Shorter Debt Maturities, Lower Financing Needs, and Relies Mainly on Equity
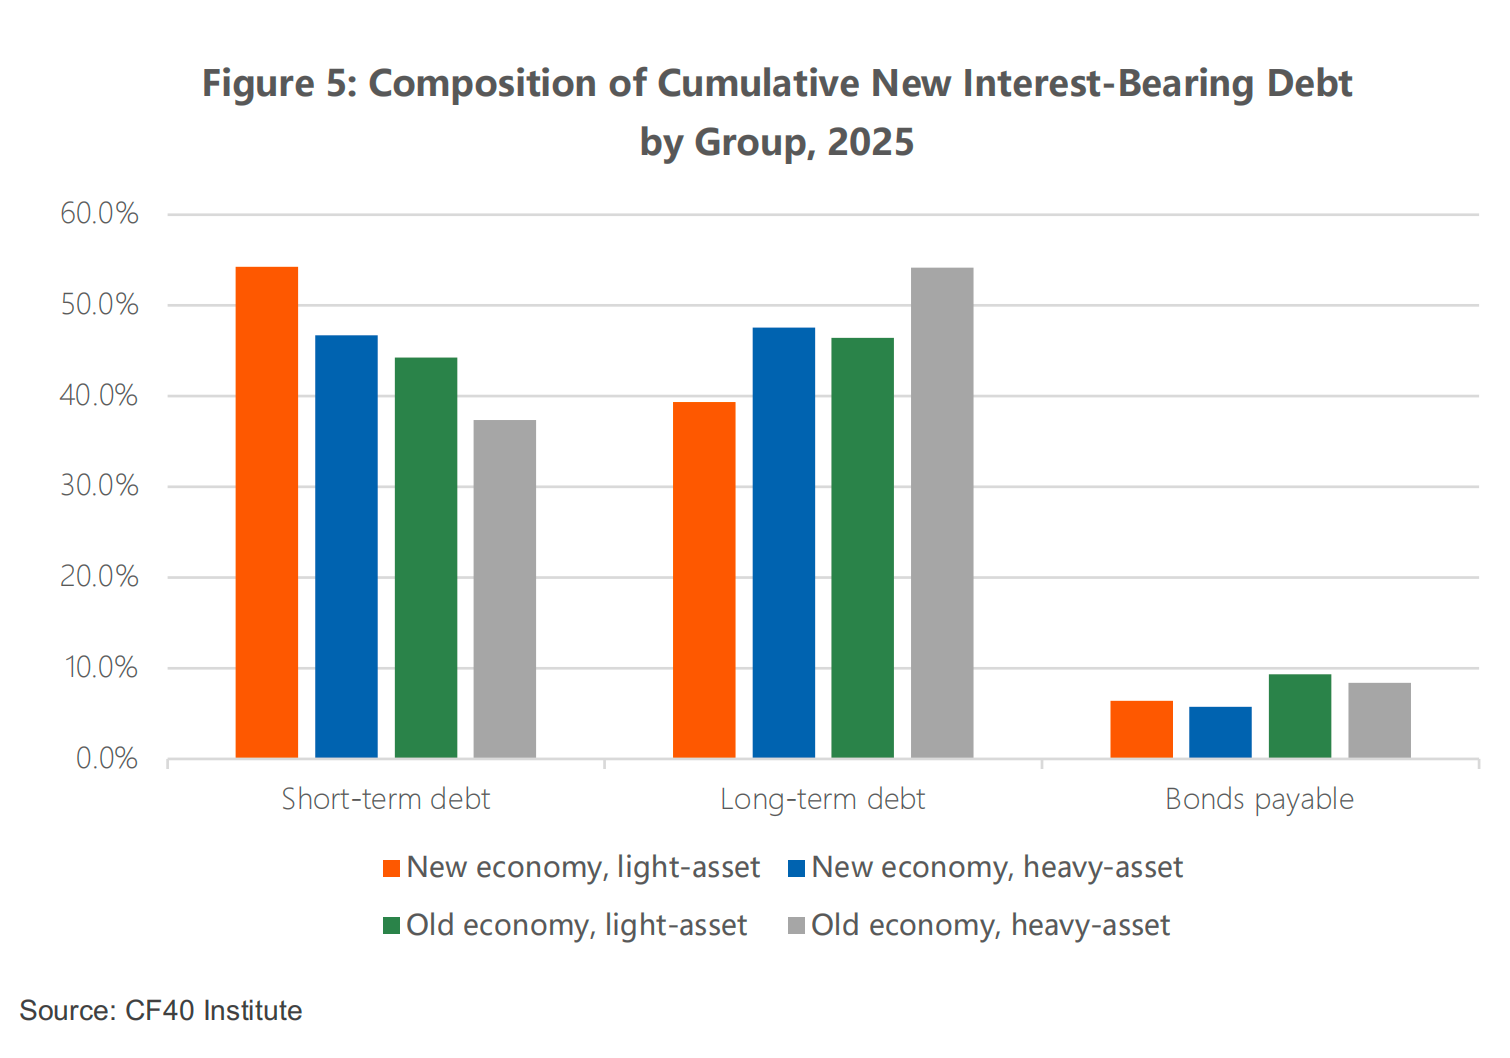
If banks were subsidizing the new economy through long-term, low-cost funds, long-term borrowing should dominate. However, data show the opposite. Looking at debt maturity across the four groups, in 2025 short-term debt made up 54.2% of interest-bearing debt for the new economy, light-asset group, 46.7% for the new economy, heavy-asset group, 44.2% for the old economy, light-asset group, and 37.4% for the old economy, heavy-asset group.
The share of short-term debt declines steadily as one moves from the new economy to the old economy, and from light-asset firms to heavy-asset firms. In the two new-economy groups, the short-term debt share is 10–17 percentage points higher than in the old economy, heavy-asset group.
This difference reflects not higher risk in the new economy, but rather the distinct financing needs associated with different business models. Heavy-asset traditional sectors—infrastructure, power, property, coal—have long project horizons and need matching long-term funds; New economy firms rely primarily on operating cash flow and equity, have minimal need for external debt, and generally use the small amount of debt they do carry for working capital purposes; as a result, short-term financing naturally dominates their capital structure.
A few representative new economy firms illustrate the point directly. Sungrow, a leader in solar inverters and energy storage, saw revenue grow from 10.4 billion yuan to 89.2 billion yuan over 2018–2025 (about 8.6x), yet its interest-bearing debt stayed in the low tens of billions, and government subsidies were just 0.18% of its cumulative eight-year revenue.
Mindray, a leader in medical devices, grew revenue about 2.4x with almost no reliance on interest-bearing debt (near zero for years), and subsidies were only about 2% of net profit.
BYD, a leader in electric vehicles, saw interest-bearing debt rise from 59.2 billion yuan in 2018 to 110.5 billion yuan in 2025—up 51.3 billion yuan over eight years—while revenue grew from 130.1 billion yuan to 804.0 billion yuan (about 6.2x), with cumulative government subsidies just 0.55% of revenue; as net profit grew rapidly, subsidies fell as a share of net profit year after year.
These fastest-growing, most globally competitive new-economy firms are precisely the ones that relied little on either loans or subsidies. This runs directly counter to the narrative that emerging industries can only grow with the help of bank credit and government subsidies.
The financing-need angle helps further explain these differences. When a firm needs to raise capital expenditure, the funds come from two sources, internal financing and external financing. Internal financing refers to using the company’s own earnings to fund new investment, while external financing refers to funds raised from outside the company—including both direct and indirect financing—to support new investment.
We proxy internal financing by recurring surplus after dividends and interest, and compare it with capital expenditure; the focus is whether each group’s internal funds can cover its own capital spending, with the gap interpreted as a theoretical financing shortfall.
Figure 6 presents our calculations for the four groups. The relationship between internal funds and capital spending differs sharply across firm types. The clearest case is the new economy, light-asset group: its internal funds exceed its capital expenditure overall, meaning that in theory this group needs no external funds at all to cover its capital spending.
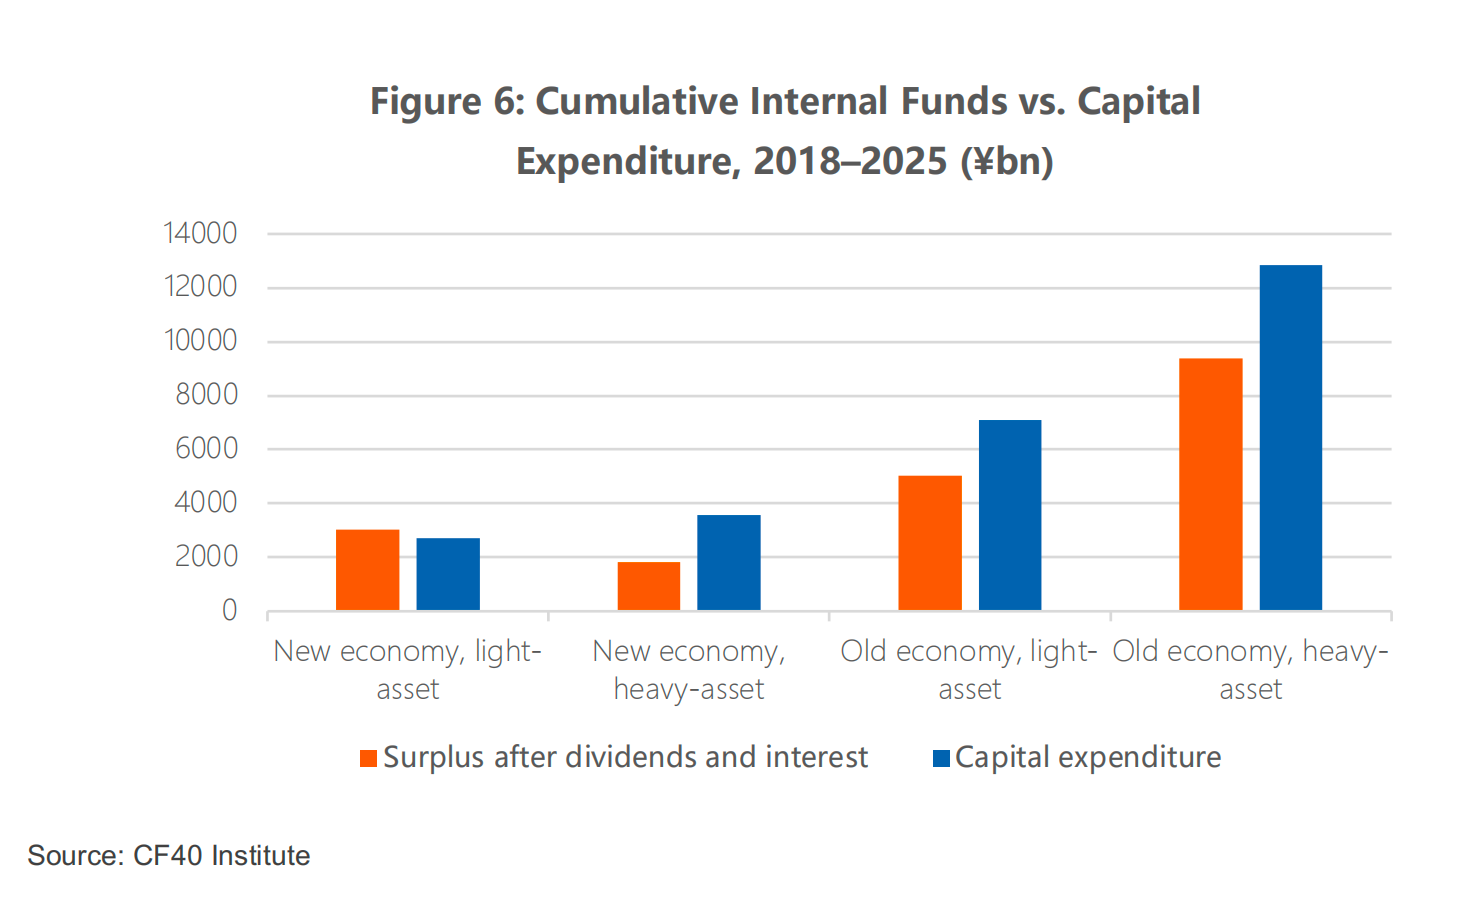
By contrast, the gaps between internal funds and capital expenditure are far larger for the new economy & heavy-asset group, the old economy & light-asset group and the old economy & heavy-asset group. Moreover, the old economy’s capital expenditure is markedly higher—nearly 20 trillion yuan cumulatively over eight years, more than three times that of the new economy groups— directly reflecting the old economy’s greater reliance on investment and hence on external financing.
The above is only a theoretical shortfall and does not mean the new economy, light-asset group truly needs no external financing. But in practice, when internal funds fall short of capital spending and external financing is required, the new and old economy choose very different routes: the new economy relies mainly on equity, the old economy mainly on debt.
As Figures 7 and 8 show, over 2019–2025 the new economy, light-asset group raised 2.0 trillion yuan in equity against only 640.2 billion yuan in new interest- bearing debt while equity was three times debt, or 75% of external financing.
The new economy, heavy-asset group raised 1.7 trillion yuan in equity and 1.1 trillion yuan in new interest-bearing debt, with equity at 60% of external financing.
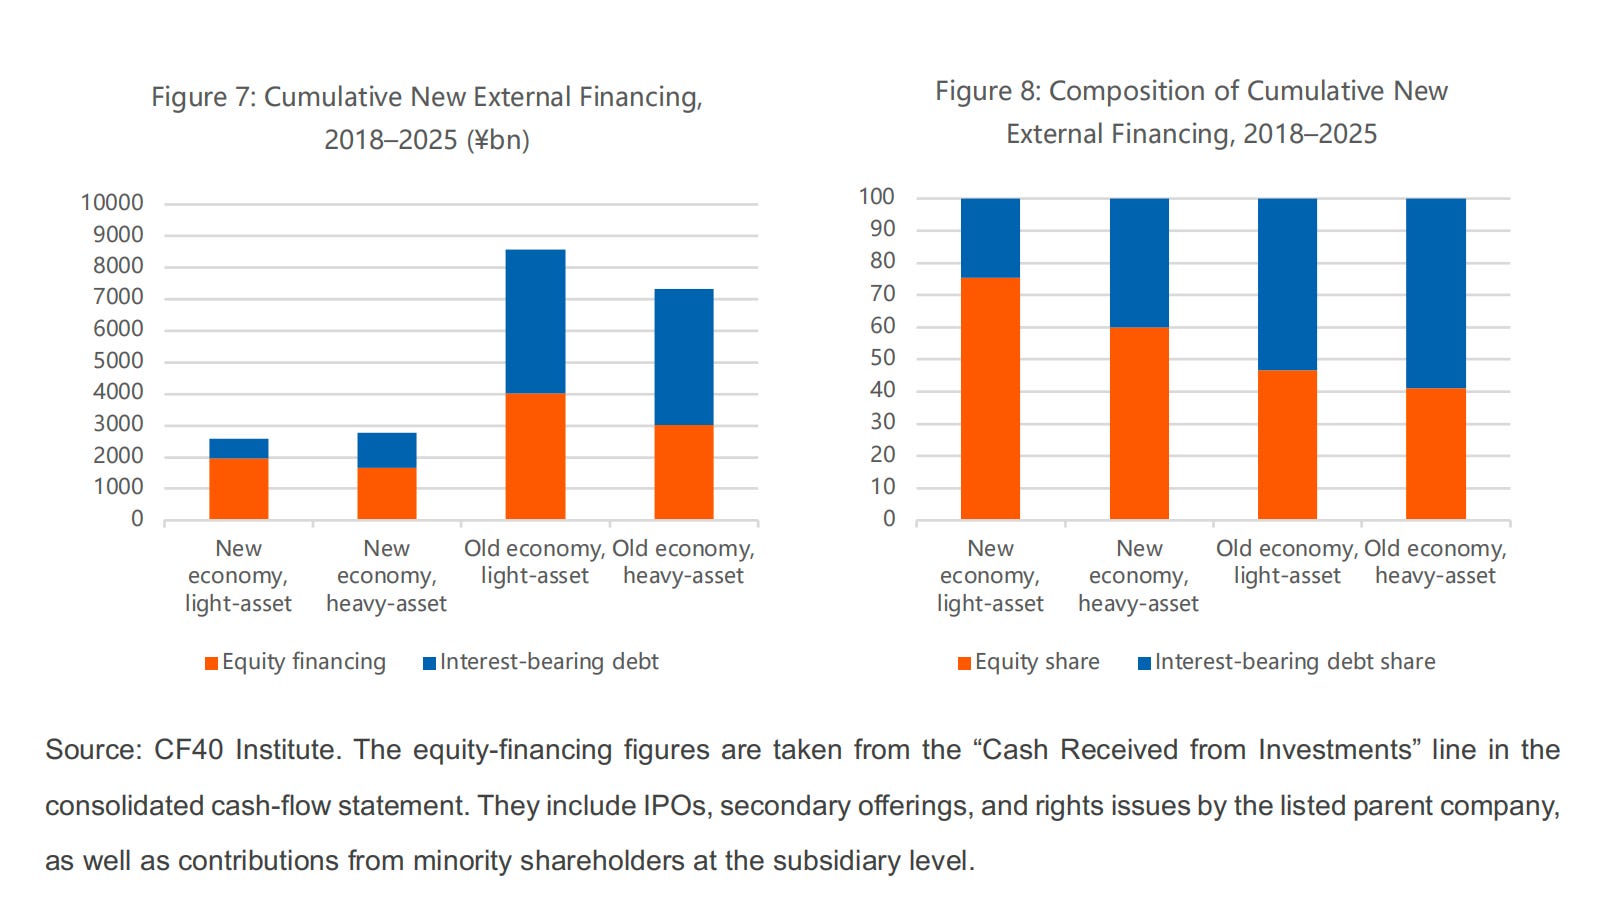
The old economy is the reverse: equity makes up 47% of external financing for the old economy, light-asset group; and just 41% for the old economy, heavy-asset group, with more than half of external funds coming from debt. By equity share of external financing, the four groups form a continuous spectrum: new economy, light-asset group 75%; new economy, heavy-asset group 60%; old economy, light-asset group 47%; old economy, heavy-asset group 41%.
This too accords with the common understanding of the new economy: equity financing is a market-based capital-structure choice. It needs not be repaid and its risk is shared by investors, matching the new economy’s “high up-front investment, high future return” growth profile. That is a fundamentally different arrangement from “targeted financial subsidies.”
III. Subsidies Are Not Concentrated in the New Economy, Nor is the New Economy Dependent on Them
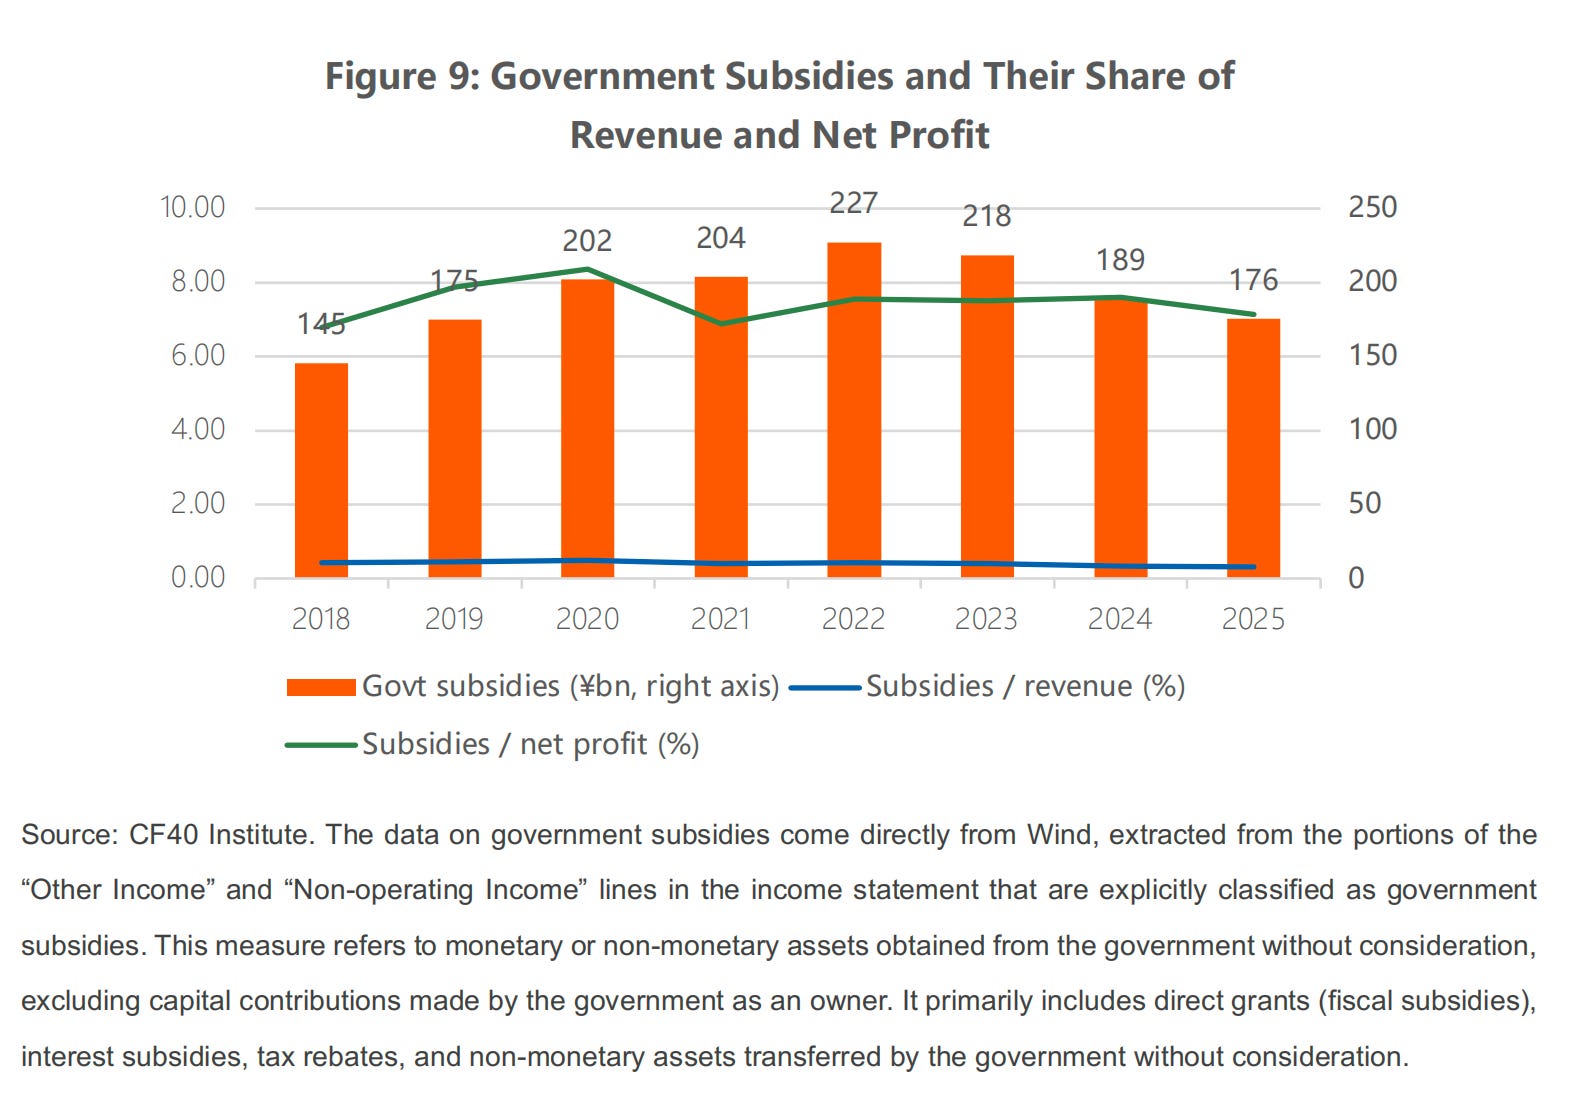
Since 2022, both the overall scale and the intensity of government subsidies have declined. Over 2018–2025, total government subsidies received by listed companies traced an inverted U, rising then falling. They peaked in 2022 at 227.2 billion yuan and then declined year after year. By 2025 they had fallen from that peak to 175.8 billion yuan, a 22.6% drop over four years, roughly back to the 2019 level.
Meanwhile, government subsidies were less than 0.5% of listed companies’ total revenue and fluctuated between 6.8% and 8.3% of net profit; in 2025 they were just 0.3% of total revenue and 7.14% of net profit—below the 7.56% average of 2022–2024 and among the lower readings of the past eight years.
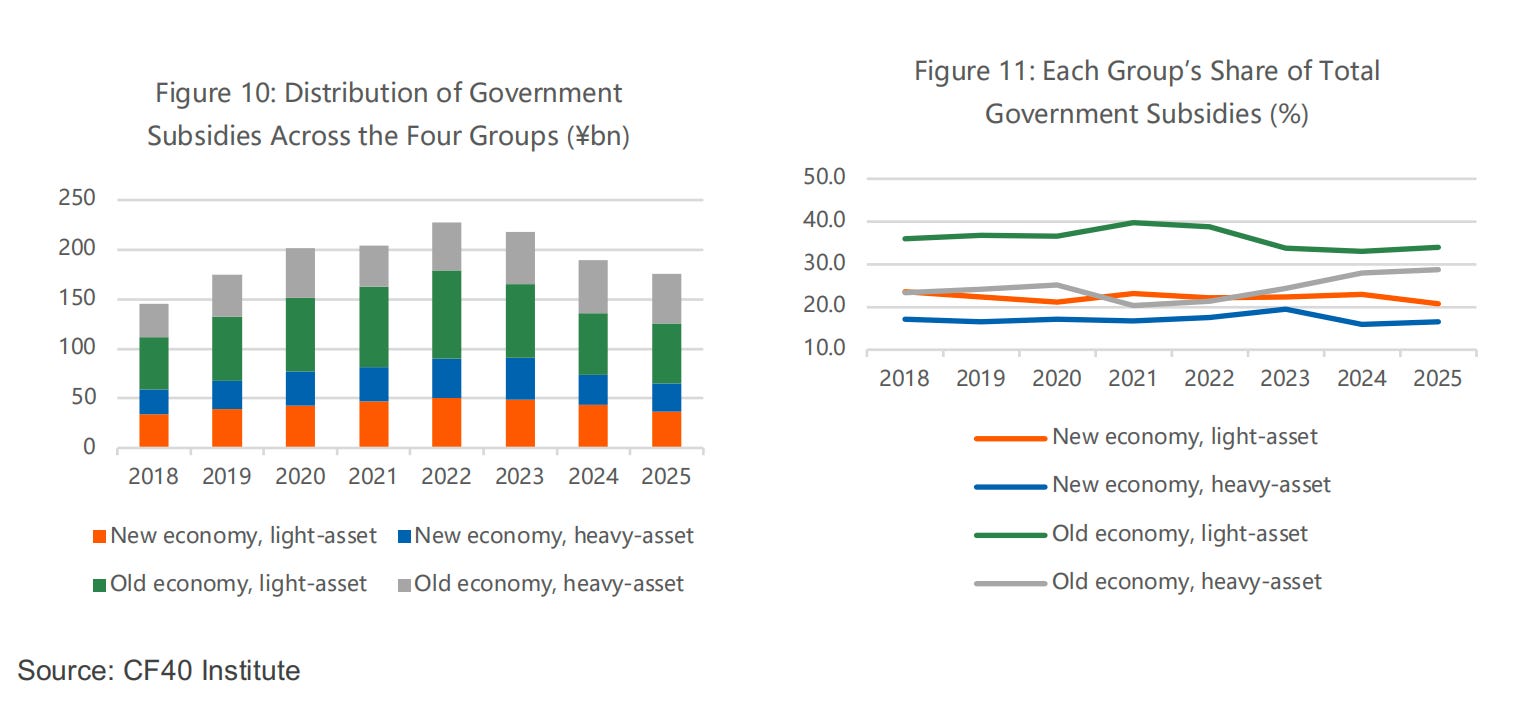
By structure, about one-third of government subsidies go to the new economy and about two-thirds to the old economy. Within the old economy, the light-asset group has the largest amount and share, as it includes many traditional automakers and home-appliance firms.
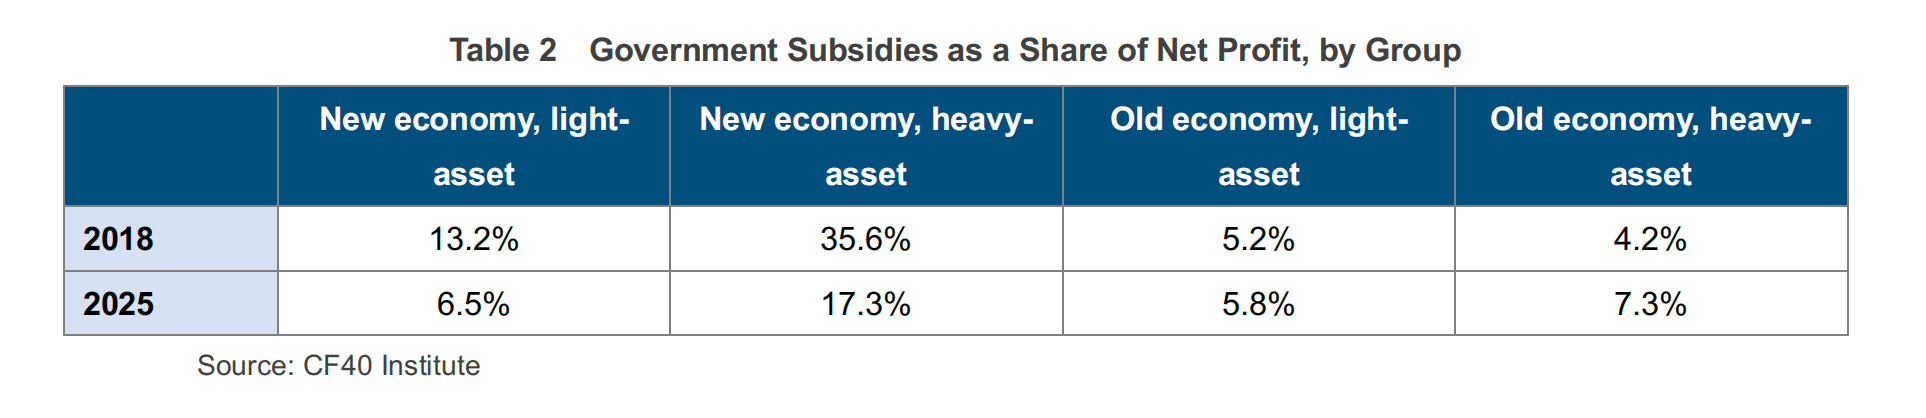
Measured as a share of each group’s own net profit, subsidies are indeed higher for the new economy than for the old economy—meaning that although the absolute subsidy is small for the new economy, its effect on net profit is not negligible (see Table 2).
One objective fact must be acknowledged: in earlier years, some new-economy industries and firms did rely on subsidies to a notable extent. Take the new economy, heavy-asset group: in 2018, subsidies were as high as 35.6% of its net profit. The trajectories of two leading firms are especially telling.
At SMIC, the semiconductor leader, the 2018 subsidy (1.1 billion yuan) was more than three times that year’s net profit (0.4 billion yuan) and nearly 5% of revenue. At BYD, the EV leader, the 2018 subsidy was 58% of net profit and about 1.6% of revenue. In years when profits were still unsteady, subsidies were once a non-trivial line on the income statement.
In recent years, however, this has changed markedly: as these firms’ own profitability has improved, the relative importance of subsidies to new-economy firms has fallen rapidly. From 2018 to 2025, subsidies as a share of net profit fell sharply for the new-economy sectors—from 13.2% to 6.5% for the new economy, light-asset group, and from 35.6% to 17.3% for the new economy, heavy-asset group. The old economy, by contrast, grew more dependent on subsidies, especially its heavy-asset group, where subsidies rose from 4.2% to 7.3% of net profit.
Consider the same two firms. At SMIC, subsidies fell from more than 300% of net profit in 2018 to 22% in 2025, and from nearly 5% of revenue to 2.3%. The change at BYD is even starker: its subsidies barely grew over the eight years, staying around 2–3 billion yuan, but as net profit rose from 3.6 billion yuan to 33.8 billion yuan and revenue topped 800 billion yuan, subsidies fell from 58% of net profit to about 7%, and from 1.6% of revenue to 0.3%.
In other words, these firms expanded not by collecting ever-larger subsidies but mainly through their own internal profitability. Hence, even though some industries were relatively dependent on subsidies in the early stage of the emerging industries, after several years of development the new economy’s reliance on subsidies has fallen substantially.
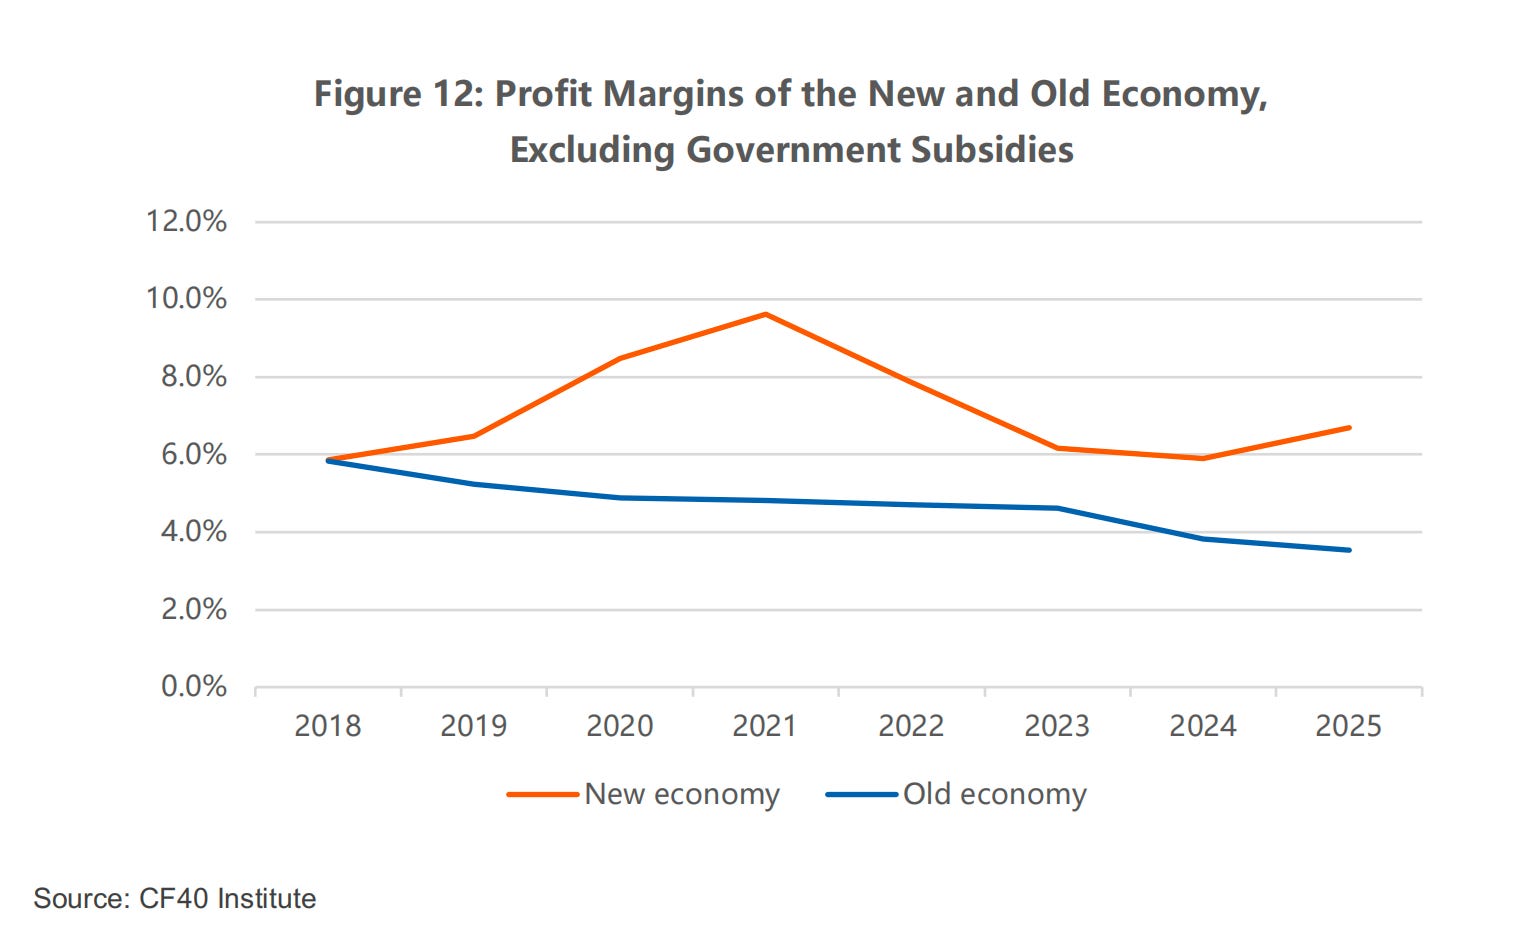
We can also run a simple counterfactual: how much would each group’s profit margin (net profit/revenue) change if all government subsidies were stripped out? Subtracting subsidies from both the numerator and the denominator yields a subsidy-free margin; the gap between this and the actual margin is the margin attributable to subsidies.
As Figure 12 shows, after removing government subsidies, the margins of the new and old economy still diverge clearly: the old economy’s margin keeps declining, while the new economy’s margin tracks the business cycle closely.
IV. A Sub-Sample Analysis of 57 Representative Emerging- Industry Listed Companies
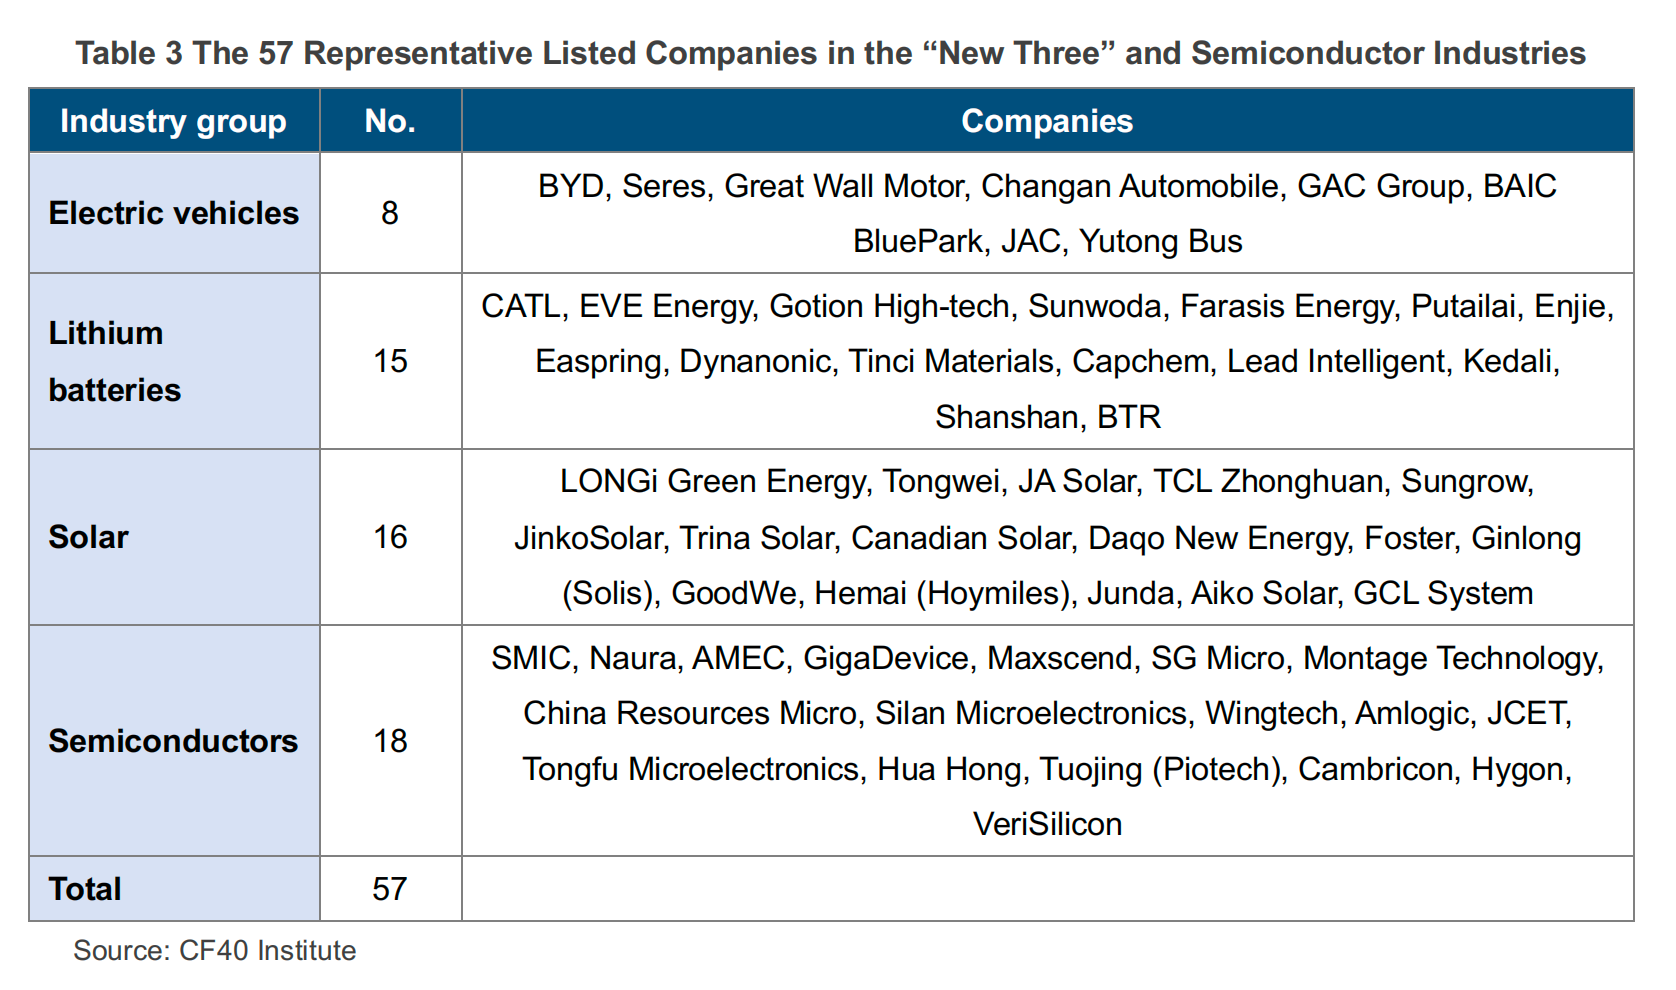
Finally, we select four representative emerging industries from the new economy group – electric vehicles, lithium batteries, solar, and semiconductors – which are also explicitly listed as emerging industries in the OECD report. Together, these industries comprise 57 A-share listed companies, which we examine as a separate sample. These 57 cover the leading A-share firms in the four industries, including the largest and most representative by revenue, listed in Table 3.
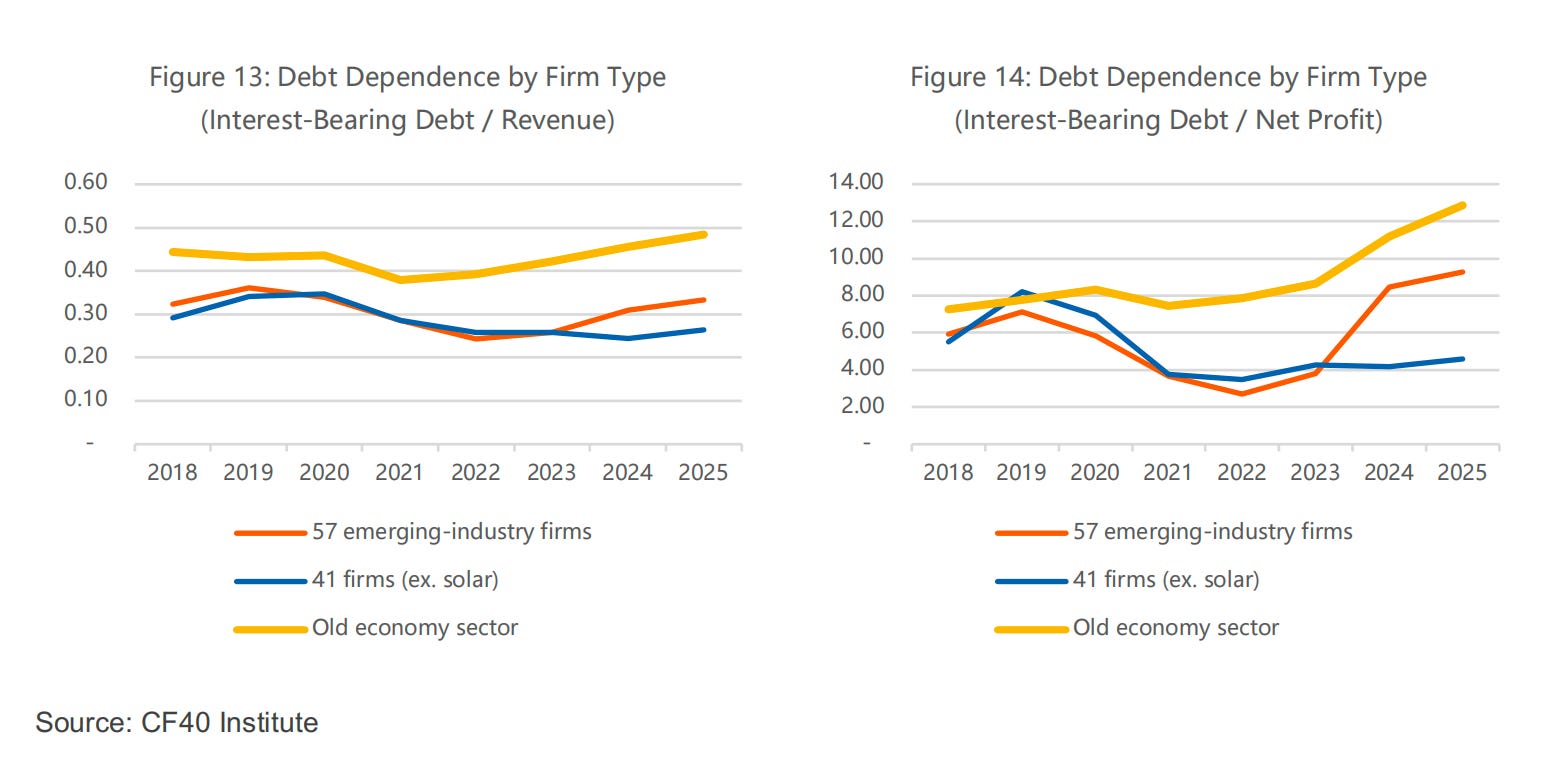
First, these 57 representative firms depend far less on debt than the old-economy sector, and because the old economy’s debt dependence keeps rising, the gap is still widening. We gauge a firm’s reliance on debt issuance with two ratios—interest-bearing debt/revenue and interest-bearing debt/net profit; the higher the ratio, the more outstanding debt is needed per unit of new revenue or net profit.
As Figure 13 shows, the 57 representative emerging-industry firms’ revenue- based debt dependence is markedly lower than the old economy’s. On the net- profit measure, the 57 firms’ debt-to-net-profit ratio was not noticeably different from the old economy’s over 2018–2020, but thereafter it fell sharply and steadily until rising again in 2024.
Given that the solar industry suffered sector-wide losses in both 2024 and 2025, we also computed a 41-firm sample excluding solar; the result is clearer still. As Figure 14 shows, the 41 firms and the two old-economy groups differ significantly not only in levels but in a gap that has widened since 2021—mainly because the old economy’s debt dependence keeps rising, while the 41 firms’ debt dependence has trended gradually lower and stayed low.
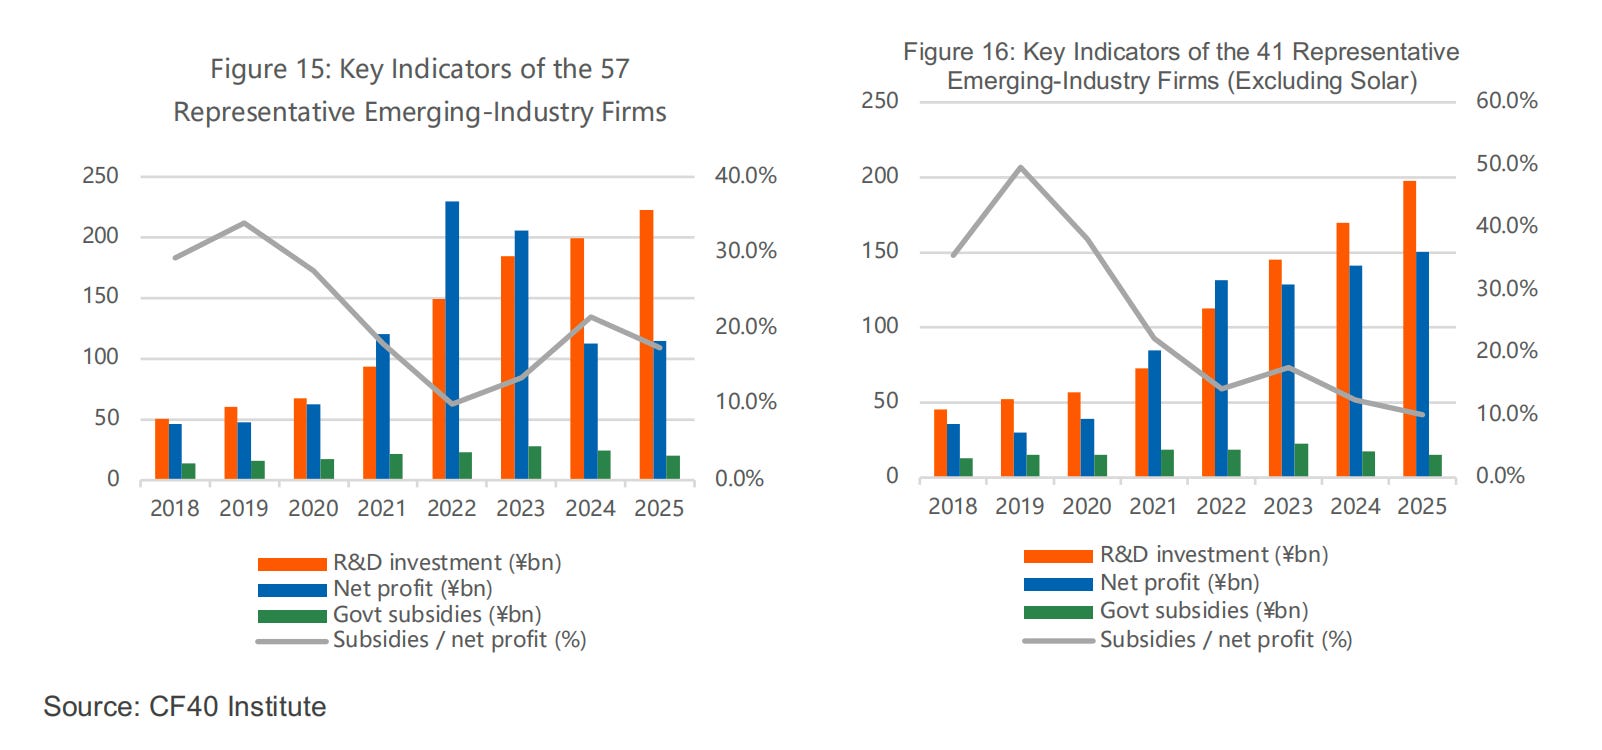
Second, the emerging industries’ reliance on government subsidies has kept falling, and markedly so. As Figure 15 shows, since 2021 these 57 representative emerging-industry firms have grown rapidly, with net profit and R&D investment both expanding sharply.
Over the same period government subsidies did not rise meaningfully; they peaked in 2023 and then fell for two straight years, and their effect on net profit declined even more sharply. Note that the 57 firms’ net profit plunged in 2024 and 2025, chiefly because sector-wide losses in solar dragged down the sample’s aggregate profit.
Excluding the 16 solar-related firms, the remaining 41 representative emerging- industry firms display this feature even more strongly (Figure 16). After 2021, R&D investment and net profit expanded substantially while the role of government subsidies kept weakening sharply. In particular, since 2023 these firms’ annual R&D investment has consistently exceeded their net profit— returning to the pattern of 2018–2020 when the industries were first emerging, except that the subsidies received in 2023–2025 are far less important than they were then.
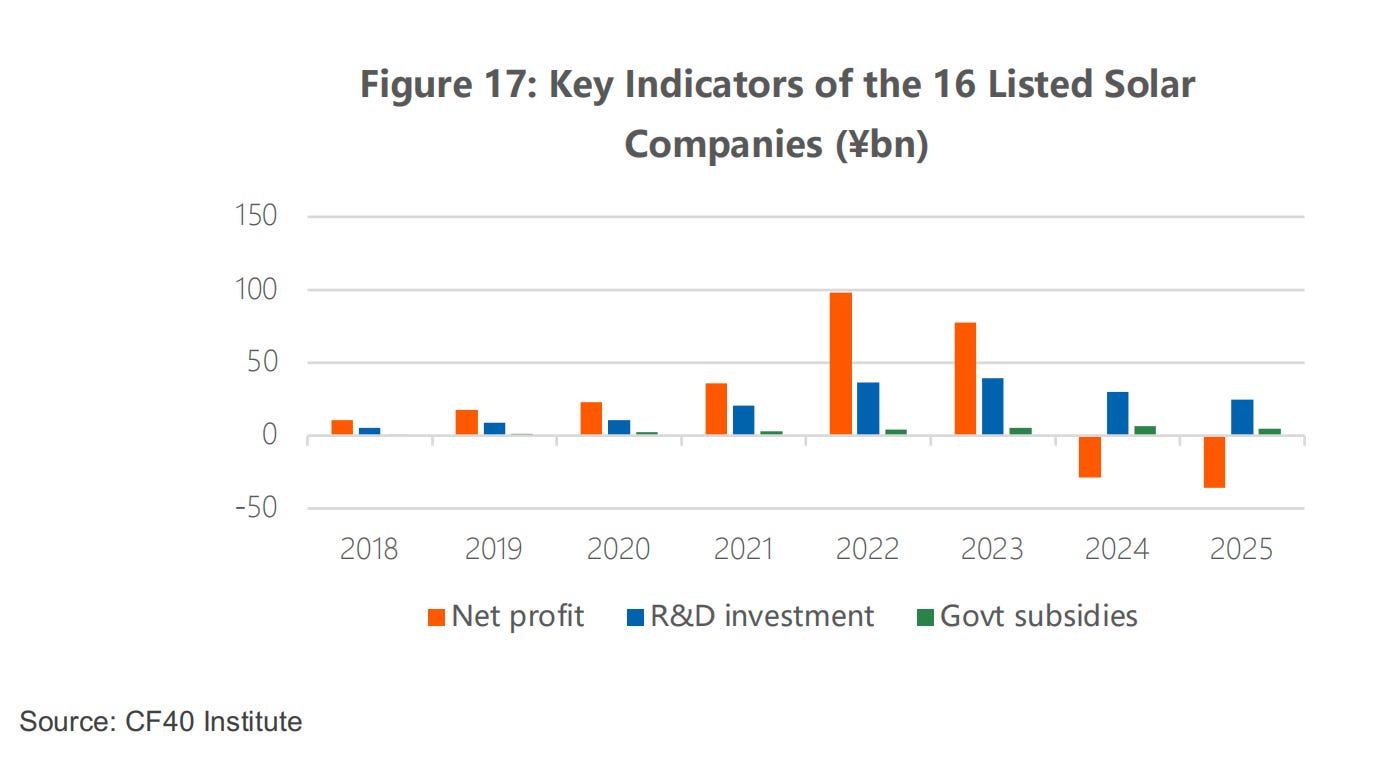
Even in the case of the solar PV industry, its performance is difficult to explain through a framework of subsidies driving growth or subsidies sustaining survival. As the figure shows, after sustained expansion over 2018–2023, solar posted negative net profit in both 2024 and 2025. Yet in both expansion and loss-making periods, government subsidies were a small share of net profit and R&D investment, and there was no marked increase in subsidies during the loss-making years.
In 2025 the 16 listed solar firms posted net profit of -35.5 billion yuan, a worse loss than in 2024 (-28.7 billion yuan), yet the subsidies they received fell from 6.7 billion yuan to 4.9 billion yuan. Moreover, while solar R&D investment did dip during the losses, it stayed at a high level—which we see as the main reason the industry can keep advancing technologically and securing market competitiveness.
V. Concluding Observations
Our analysis shows that for both credit and cash subsidies, the main recipients are traditional sectors carrying long-horizon investment, not the emerging industries. The new economy has shorter debt maturities, sizable internal funds and equity-led external financing; government subsidies are less than half a percent of its revenue, and its reliance on them keeps falling.
In the early stage of the emerging industries, some firms did rely on subsidies to some extent, but most new economy industries depend little on either subsidies or credit. More importantly, during the recent phase of rapid expansion in the new economy, the scale of subsidies has been declining and their effect on the new economy ever smaller. Neither credit subsidies nor government subsidies, therefore, can explain why China’s new economy has expanded so rapidly in recent years. The narrative that China’s emerging industries are built on subsidies cannot hold water.
This conclusion carries at least three implications.
First, the OECD’s drawing of such a consequential and questionable conclusion from a small sample represents a pattern of conduct that could materially undermine the credibility of multilateral institutions. Global imbalances are a major issue closely watched by all countries, and clarifying their roots matters greatly. As a multilateral institution, the OECD on the one hand made an elementary error about China’s benchmark- rate system and yet concluded that firms obtained below-market financing. And on the other hand, on the basis of a small sample of 525 global firms (147 of them Chinese), reached the sweeping conclusion that China’s emerging industries grew primarily on subsidies and thereby gained global competitiveness.
This is far from serious research and falls well short of the objectivity and professionalism expected of the OECD. Should such findings become the basis for some countries’ protective policies, the report would have opened a Pandora’s box—inflicting real damage on the credibility of the multilateral system and leaving an already embattled set of international rules even more exposed to challenge and doubt.
Second, even if China were to eliminate all subsidies, the new economy’s prospects and global competitiveness would not be undermined, because they were never created by subsidies in the first place. From 2018 to 2025, the new economy’s reliance on subsidies fell sharply—from 13.2% to 6.5% for the new economy & light-asset group and from 35.6% to 17.3% for the new economy & heavy-asset group. It was precisely during this rapid retreat of subsidy intensity that the new economy expanded fastest.
In the subsidy-free counterfactual, the margin divergence between the new and old economy remains clear. This shows that the new economy’s growth rests on scale expansion, genuine gains in profitability, ample internal accumulation and market-based equity financing—not on a continued infusion of subsidies—so the marginal withdrawal of subsidies would not shake the foundations of that growth.
Third, global imbalances are a genuine global problem that deserves serious attention, and China still has ample room to expand domestic demand and improve its domestic resource allocation. Our analysis does not deny the importance of global imbalances, nor that China has much room to expand domestic demand.
From a resource-allocation perspective in particular, the heavy concentration of new interest-bearing debt in a few infrastructure and power SOEs partly reflects legitimate factors—long project horizons and large funding needs—but may also reflect inefficient capital allocation. China’s biggest resource-allocation challenge may not be excessive support for the new economy, but rather the continued flow of resources into low-return sectors. This may also help explain why Chinese firms are highly competitive at the micro level, while aggregate productivity growth remains relatively subdued.
The implication, contrary to the OECD’s, is that if China’s resource allocation were more market-based and more efficient, the global competitiveness of its new economy would be stronger, not weaker.
Brussels Blames China. The Data Point Elsewhere

One of the most convenient stories in Brussels today is that Europe is facing a second “China Shock”: a flood of cheap Chinese goods, pushed abroad by overcapacity, subsidies, and weak demand at home.

 | A guest post by
|
I wonder whether the authors also considered capital injections from local government and its financing vehicles. Those would not necessarily have to be structured as credit or subsidy, but could also be cheap land, equity holdings by local banks or many other ways. Has that been taken in account?
OECD’s problem is that it starts from a political premise and then bends the data to reach a conclusion favorable to the West. This is not research. This is geopolitical narrative-building.
This article uses a large amount of data to expose the hypocrisy and ugliness behind the OECD’s framing. The OECD report relies heavily on so-called below-market borrowing, which accounts for two-thirds of its estimated subsidies to Chinese firms. But if the LPR is not the lowest preferential lending rate, but rather a market reference rate, then the OECD’s estimate of China’s low-interest loan subsidies is systematically overstated.
As I pointed out in my earlier report on industrial subsidies, subsidies are not unique to China. They exist across the world, and the United States is one of the most aggressive users. US industrial subsidies account for 1.34% of industrial output, higher than China’s 1.1%.
More importantly, subsidies can at most explain part of the financing environment. They cannot explain the core competitiveness of China’s new economy. The competitiveness of EVs, batteries, solar, semiconductors, computers, and new-energy equipment comes much more from scale economies, supply-chain density, engineering iteration, domestic competition, internal cash flow, and equity financing than from simple government handouts.
So why does even the OECD need to manufacture a China subsidy narrative?
There are two basic reasons.
First, it provides an external excuse for the West’s industrial defeats in global competition.
Second, it provides justification for tariffs and non-tariff barriers.
In the end, the subsidy narrative is not really about understanding China’s industrial rise. It is about giving the West a politically convenient story for why Chinese firms are winning.